
Adobe commerce analytics can tell you what happened in your store. The hard bit is turning that into a list of actions your team can deliver, with owners, deadlines, and a clear view of what success looks like. The bigger problem is prioritisation. It’s easy to spot ten “interesting” trends and still miss the one issue that’s blocking revenue, profit, or repeat purchases right now. Without a way to separate noise from signal, analytics turns into reporting instead of decision-making.
This guide shows you how to convert insight into a 90-day action plan you can run week by week. You’ll see practical examples that reflect how trading teams work in reality, plus a simple framework for choosing what to fix first and proving the impact.
What Is Adobe Commerce Analytics?
Adobe commerce analytics is the set of reporting, analysis and analytics tools you use to understand store performance, customer behaviour, and product demand inside Adobe Commerce. It brings together order data and behaviour signals so you can spot friction, prioritise fixes, and measure results without guessing.
It supports decision-making across key areas of an e-commerce operation, including trading performance, product and category performance, customer acquisition and retention, and checkout effectiveness. When the data is structured and consistent, it becomes easier to identify where revenue is being lost, where costs are being created (such as refunds and cancellations), and which changes are most likely to improve outcomes. In plain terms, it helps you move past nice charts and get to clear decisions.

How Does Adobe Commerce Analytics Work in Adobe Commerce?
Adobe commerce analytics works by collecting commerce data (orders, customers, products) and, depending on your setup, pairing it with journey data (views, add to basket, checkout steps). Advanced Reporting in Adobe Commerce runs as a cloud-based service powered by Adobe Commerce Intelligence, so reporting happens away from your live store database.
A practical way to think about the setup is a three-layer stack:
- Commerce truth: orders, refunds, customers, catalogue structure
- Behaviour truth: product views, add to basket, checkout progress, on-site search usage
- Decision layer: dashboards, segmentation, cohorts, tests, and action tracking
If you also use Adobe Analytics, Adobe supports connecting it into Commerce Intelligence, with the option to replicate up to 25 metrics and dimensions into the Commerce Intelligence warehouse so you can join it with commerce data.
Which Metrics Matter in Adobe Commerce Analytics for Revenue and Profit?
In adobe commerce analytics, the metrics that matter are the ones that point to levers your team can pull in the next 2 to 4 weeks. Start with conversion, add to basket, checkout step completion, on-site search performance, AOV split by new vs returning, refunds, cancellations, and stockouts on top sellers. Then segment to find the break point.
Here’s a practical mapping you can use in trading meetings.
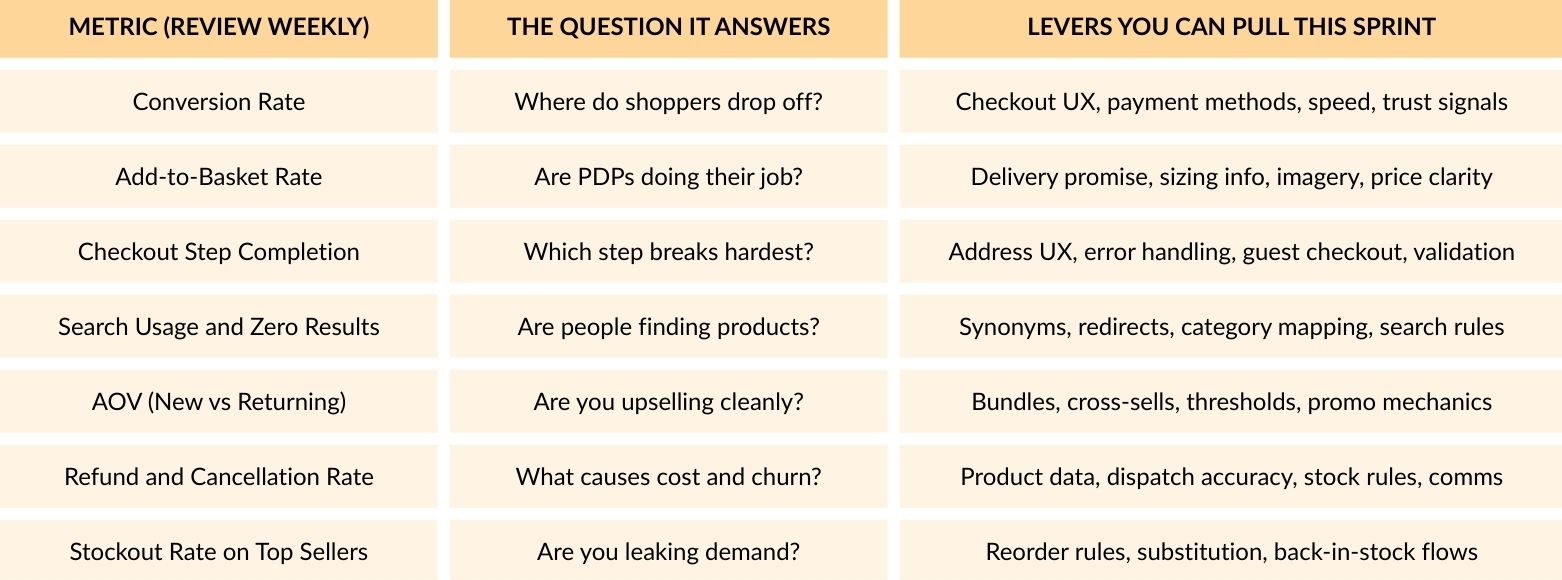
A simple rule that saves time: If you can’t do anything with a metric in the next few weeks, don’t focus on it yet. Stick to numbers that lead to clear actions.
How Do You Turn Adobe Commerce Analytics Into an Action Plan?
You turn adobe commerce analytics into an action plan by running a repeatable loop: set a goal, pick a leading indicator, segment the data, find the break point, write a tight hypothesis, choose the smallest change that could shift the number, assign an owner, then track impact on a set cadence. The aim is fast learning plus delivery.
The Insight-to-Action Ladder (Use This Weekly)
1. Set the commercial goal: Examples: lift profit per session, reduce refund cost, raise repeat purchase.
2. Pick one leading indicator: Profit per session often tracks with conversion and AOV. Refund cost tracks with returns rate and cancellation reasons.
3. Segment before diagnosis: Segment by device, channel, store view, customer type (new returning), category, and price band.
4. Find the break point: The break point is where performance shifts sharply between segments. That is your action zone.
5. Write a tight hypothesis: Example: “If we show delivery promise above the fold on PDPs, add-to-basket rate on mobile paid traffic will rise.”
6. Choose the smallest change: Avoid “rebuild checkout”. Pick changes that can ship, measure, and iterate.
7. Assign owner, effort, expected impact: Put a range on impact. Even a rough range beats vibes.
8. Ship, measure, decide: Use two checkpoints: day 7 and day 21. Decide to keep, roll back, expand.
What Does a 90-Day Action Plan Look Like in Practice?
A 90-day plan built on adobe commerce analytics groups work into trust, funnel wins, and retention wins.. Here is a structure that fits real teams.
Day 1 to 14: Data Confidence and Quick Wins
- Align order totals, discounts, shipping, tax, refunds, and cancellations across reporting
- Build a “trading snapshot” dashboard used in the weekly meeting
- Fix obvious tracking gaps (missing purchase events, duplicate events, broken UTMs)
- Ship 3 quick wins tied to clear break points (mobile checkout errors, slow category pages, zero-result)
Day 15 to 45: Funnel and Merchandising Levers
- Build a funnel view split by device and channel
- Tackle the biggest leak with one change at a time
- Build a “search demand” view: top searches, zero results, refinements used
- Fix product data gaps that drive refunds: sizing clarity, compatibility details, delivery rules
Day 46 to 90: Cohorts, Retention, and Margin-Aware Decisions
- Build cohorts by first purchase category and first order value band
- Map repeat behaviour: typical time between orders, typical basket mix
- Add profit proxies to reporting so you do not chase discount-driven revenue
- Run 2 to 3 retention experiments (reorder journeys, post-purchase content, loyalty nudges)
How Do You Validate Tracking So Adobe Commerce Analytics Is Trustworthy?
You validate adobe commerce analytics by checking that transactional truth matches event truth on the basics: order IDs, revenue, discounts, refunds, currency, and duplicates. Run weekly journey tests, document event definitions, and compare reporting totals against core finance numbers. Fixing trust issues early prevents endless debate in trading meetings.
Quick Validation Checklist (Run Monthly)
- Purchase event fires once per order
- Revenue logic matches your business rules (discounts shipping tax)
- Refunds and cancellations appear consistently
- Currency and store view handling is correct
- Payment redirects do not break sessions
- Key journeys tested: search, PDP, add to basket, checkout, thank you page
Adobe’s Advanced Reporting is described as a cloud service powered by Adobe Commerce Intelligence, so it is built to handle reporting away from the live store.
What Dashboards Should You Build in Adobe Commerce Analytics?
Dashboards in adobe commerce analytics work best when each has one audience and one decision purpose. Build a trading snapshot for weekly meetings, a funnel view for UX fixes, a merchandising and search view for demand and range gaps, a marketing view linked to profit proxies, and an ops view for dispatch and stock issues. Keep each dashboard lean enough to use weekly.
Recommended Dashboard Set
- Trading Snapshot: Sessions, conversion, AOV, net revenue, top categories, stockouts, refunds
- Funnel and Checkout Diagnosis: Step completion split by device and channel
- Merchandising and Search Demand: Top searches, zero results, exits, product view-to-basket rate
- Marketing Performance: Channel mix, landing page performance, new customer efficiency, promo impact
- Operations and Fulfilment: Dispatch time, cancellation reasons, stock allocation, refund drivers
Adobe describes Advanced Reporting as giving access to dynamic reports based on product, order, and customer data, with a personalised dashboard experience.
How Do You Make Analytics Useful Across Teams?
You make adobe commerce analytics useful by turning insights into owned tasks with deadlines and a clear definition of “better”. Set a weekly cadence: review one dashboard, pick three actions, assign owners, log hypotheses, and track impact the next week. Link each action to a metric and a segment so everybody knows what success looks like.
The Meeting Format That Keeps Analytics Actionable
- 15 mins: Trading snapshot and break points (what shifted and where)
- 20 mins: Deep dive on one break point
- 15 mins: Agree actions (max three), owners, due dates, expected impact
- 10 mins: Review last week’s actions and decide keep, roll back, expand
Conclusion
Turning adobe commerce analytics into an action plan starts with data you can trust, then segmentation to pinpoint the biggest drop-off or cost driver, followed by a clear hypothesis and a change you can measure within 7 to 21 days. Focus on metrics linked to real levers such as checkout completion, add-to-basket rate, on-site search performance, stockouts, and refund drivers. Keep a weekly routine with three owned actions and tracked outcomes, and adobe commerce analytics becomes a practical roadmap for measurable growth.