
Most eCommerce dashboards are full of numbers that make you feel busy without telling you anything useful. Total sessions, followers, gross revenue: they go up and down, but they rarely tell you what to fix. The KPIs that matter are the ones that expose exactly where your store leaks money and point to the action that recovers it. This guide skips the obvious vanity metrics and covers the seven eCommerce KPIs that most brands underuse, and what to do when each one looks wrong.
These are the numbers we look at first in a 5MS growth review, because they turn a vague sense that something is off into a specific, fixable problem. Read them together and you get an honest picture of how your business is really performing.
Mobile vs desktop conversion gap
~2.9% vs ~3.9%
Mobile cart abandonment, vs ~66% desktop
Industry data
Average repeat purchase rate
Good is 20-40%
Repeat customers spend vs first-timers
Industry data
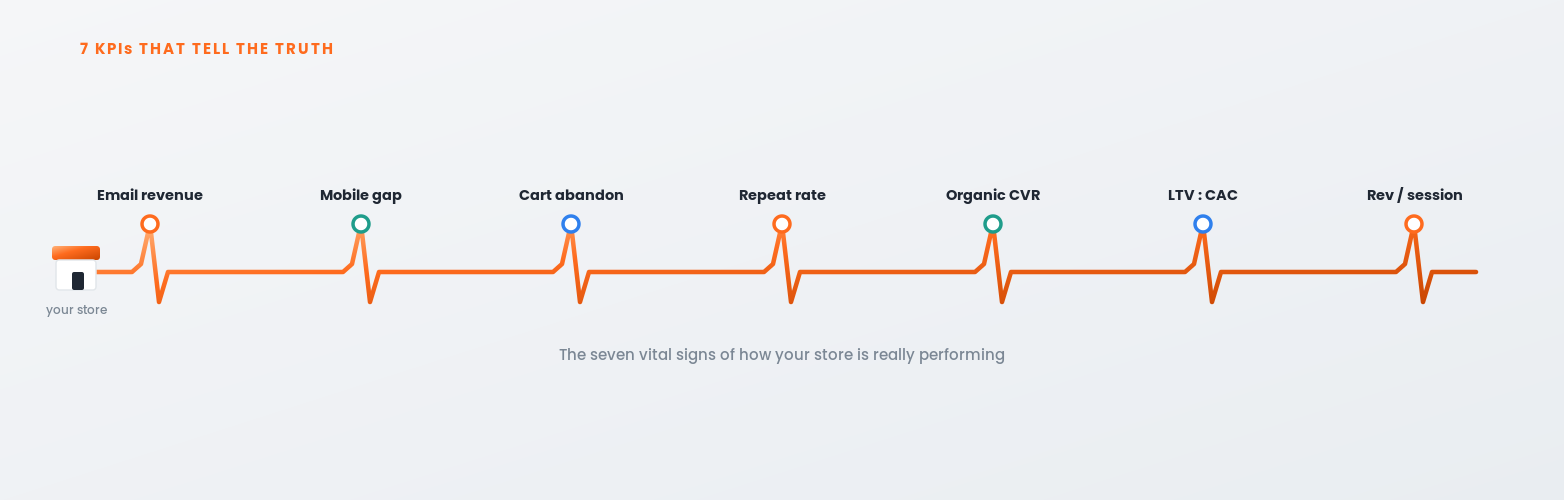
The most important eCommerce KPIs are the ones that show where you leak revenue and what to fix: email-attributed revenue, the mobile versus desktop conversion gap, cart abandonment by device, repeat purchase rate, organic traffic conversion rate, the lifetime value to acquisition cost ratio, and revenue per session. Together they reveal whether your traffic converts, whether mobile is holding you back, whether customers come back, and whether your growth is profitable. Track these seven, not vanity metrics like total sessions or followers.
Vanity metrics are numbers that look impressive but do not change a decision. Total sessions, social followers and gross revenue all fit the description: they can rise while your business quietly gets less profitable. Traffic can double while conversion halves. Revenue can grow while margins collapse under rising ad costs. On their own, these numbers reassure you without telling you what to do.
The KPIs worth tracking share one trait: each one points to a specific action. If your mobile conversion gap is wide, you fix mobile. If cart abandonment on mobile is high, you fix mobile checkout. If repeat purchase rate is low, you invest in retention. A good KPI is a diagnosis, not a scoreboard.
The seven below are the ones brands most often ignore, precisely because they are less flattering than a big traffic number. That is exactly why they are useful. Track them together and read them as a set, because the story is usually in how they relate to one another.
What it means: the share of total revenue driven by email and SMS. Top brands reach 30 to 40%. It shows how much of your revenue comes from customers you already own, rather than traffic you rent.
If it is wrong: low email revenue almost always means your automated flows are missing or not firing. Build abandoned cart, welcome, post-purchase and win-back flows first. See our email marketing service.
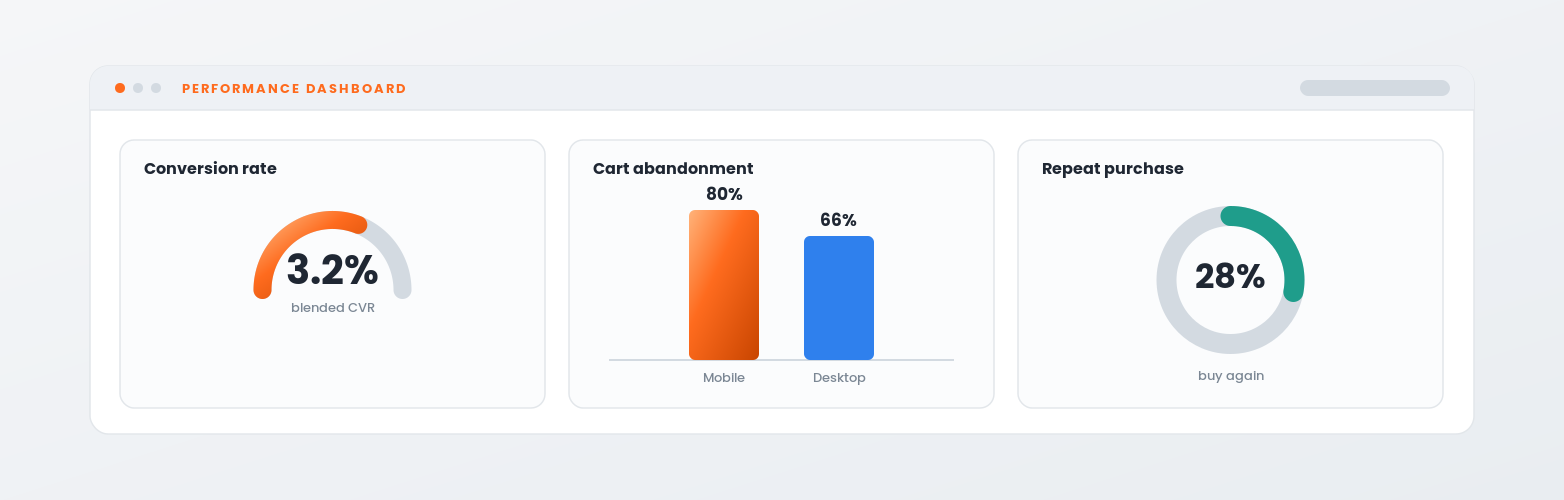
What it means: your conversion rate split by device. Mobile typically converts around 2.9% against desktop’s 3.9%, yet mobile now drives the majority of traffic. A wide gap on high mobile traffic is lost revenue hiding in plain sight.
If it is wrong: a gap much wider than a point signals a mobile experience problem. Fix mobile page speed, simplify the mobile layout and add express payments. Our eCommerce UX guide covers the fixes.
What it means: the percentage of carts abandoned, split by device. The overall average is around 70%, but mobile runs near 80% against roughly 66% on desktop. Looking at a single blended number hides where the checkout is actually failing.
If it is wrong: high mobile abandonment points at checkout friction: too many fields, forced account creation, or surprise shipping costs. Add guest checkout and express wallets, and recover the rest with a Klaviyo abandoned-cart flow.
What it means: the share of customers who buy again. The average sits around 28%, with a healthy range of 20 to 40% and top brands beyond that. Since repeat customers spend far more over time than first-timers, this KPI predicts profitability better than almost any other.
If it is wrong: a low rate means you are acquiring customers and losing them. Invest in post-purchase flows, a loyalty programme and replenishment reminders. Retention is usually the cheapest growth available.
What it means: how well your unpaid search traffic converts, tracked separately from paid. Organic visitors are free, so their conversion rate has an outsized effect on profit. Blending it into a site-wide average hides whether your SEO is attracting buyers or just browsers.
If it is wrong: low organic conversion usually means you rank for the wrong intent or your landing pages do not match the search. Align content and category pages to buyer intent, not just traffic volume.
What it means: the ratio of what a customer is worth over their lifetime to what it costs to acquire them. It is the single best test of whether your growth is profitable. A ratio around 3:1 or better is generally healthy; close to 1:1 means you are buying revenue at no profit.
If it is wrong: a thin ratio means either acquisition is too expensive or lifetime value is too low. Lift LTV with retention before scaling spend, or your ads simply multiply a loss.
What it means: total revenue divided by sessions, combining conversion rate and average order value into one number. It tells you how much each visit is really worth, so you can see the effect of a change without traffic swings masking it.
If it is wrong: flat or falling revenue per session while traffic grows means the extra visitors are not converting. Focus on conversion and average order value, not more traffic. See our CRO guide.
A KPI only earns its place if it changes what you do. The practical move is to review these seven on a fixed cadence, monthly for most stores, and for each one ask a single question: is this trending in the right direction, and if not, what is the one action that would move it? A KPI without an owner and a next step is just decoration.
Read them as a set, because the interesting signal is usually in the relationships. Rising traffic with flat revenue per session means a conversion problem, not a marketing win. A healthy repeat purchase rate but a thin LTV:CAC ratio means acquisition is too expensive. High desktop conversion but weak mobile conversion tells you exactly where to spend your next development sprint.
This is why measurement and optimisation belong together. Setting these up properly is the job of your analytics stack, covered in our eCommerce analytics guide, and acting on them is the heart of a sound eCommerce growth strategy. If you would like us to run the numbers on your store, a free growth audit is the quickest way in.
The seven eCommerce KPIs that actually tell you how your business is performing are email-attributed revenue, the mobile versus desktop conversion gap, cart abandonment by device, repeat purchase rate, organic traffic conversion rate, the lifetime value to acquisition cost ratio, and revenue per session. Unlike vanity metrics such as total sessions or followers, each points to a specific fix: low email revenue means missing flows; a wide mobile gap means a mobile experience problem; a low repeat rate means weak retention; a thin LTV:CAC means unprofitable acquisition. Review them monthly, read them together, and give each one an owner and a next action.
Common questions about eCommerce KPIs. Get in touch if yours is not here.
The most important eCommerce KPIs are the ones that point to a fix: email-attributed revenue, the mobile versus desktop conversion gap, cart abandonment by device, repeat purchase rate, organic traffic conversion rate, the lifetime value to acquisition cost ratio, and revenue per session. These reveal where you leak revenue and whether your growth is profitable, unlike vanity metrics such as total sessions or followers.
The average eCommerce repeat purchase rate is around 28%, with a healthy range of 20 to 40% and top brands going beyond that. It varies by category: consumables and beauty tend to run higher because of natural replenishment, while big-ticket items like electronics run lower due to longer purchase cycles. Because repeat customers spend far more over time, it is one of the strongest predictors of profitability.
Because a blended figure hides where you lose sales. Mobile converts around 2.9% against roughly 3.9% on desktop, yet mobile drives most traffic, so a wide gap is a large amount of lost revenue. Splitting conversion by device tells you whether to invest in mobile speed, layout and checkout, which is often the single highest-return fix available.
A ratio of lifetime value to customer acquisition cost of around 3:1 or better is generally considered healthy, meaning each customer is worth roughly three times what it costs to acquire them. A ratio close to 1:1 means you are effectively buying revenue at no profit. If it is thin, lift lifetime value through retention before you scale ad spend.
Revenue per session is total revenue divided by total sessions, combining conversion rate and average order value into one figure. It tells you how much each visit is worth, so you can judge the impact of a change without traffic fluctuations distorting the picture. If it is flat or falling while traffic grows, the extra visitors are not converting.
Monthly works for most stores, with a lighter weekly check on the fast-moving numbers like conversion rate and revenue per session during campaigns. The point is a fixed cadence with an owner and a next action for each KPI, rather than glancing at a dashboard when something feels off. Consistency is what turns measurement into improvement.
A metric is any number you can measure; a KPI is a metric tied to a goal that you actively manage. Sessions is a metric. Revenue per session, tracked against a target and acted on, is a KPI. The distinction matters because focusing on a handful of true KPIs beats drowning in dozens of metrics that never change a decision.
Start with whichever shows the biggest, cheapest gap. For most stores that is the mobile conversion gap or mobile cart abandonment, because mobile carries the most traffic and usually the most friction. If your email-attributed revenue is low, building flows is often the fastest win. A growth audit will tell you which one to prioritise for your specific store.
→eCommerce conversion rate optimisation: turn more visitors into buyers
→eCommerce growth strategy: fix the foundation first
Source: Baymard Institute, Cart Abandonment Rate Statistics.
By the 5MS team, UK eCommerce agency and Adobe Solution Partner. Last updated: July 2026.